California measures water use across three main sectors.
- On average, communities use 10%, agriculture uses 40% of water statewide, and the environment uses 50%. These proportions vary depending on the region and whether the year is wet or dry.
- State accounting of water for the environment includes some water used for people, notably the water dedicated to keeping the Sacramento–San Joaquin Delta fresh enough for municipal and farm use.
- Some of the water used by each sector returns to rivers and groundwater basins, where it can be used again.
Water use varies dramatically across regions and between wet and dry years
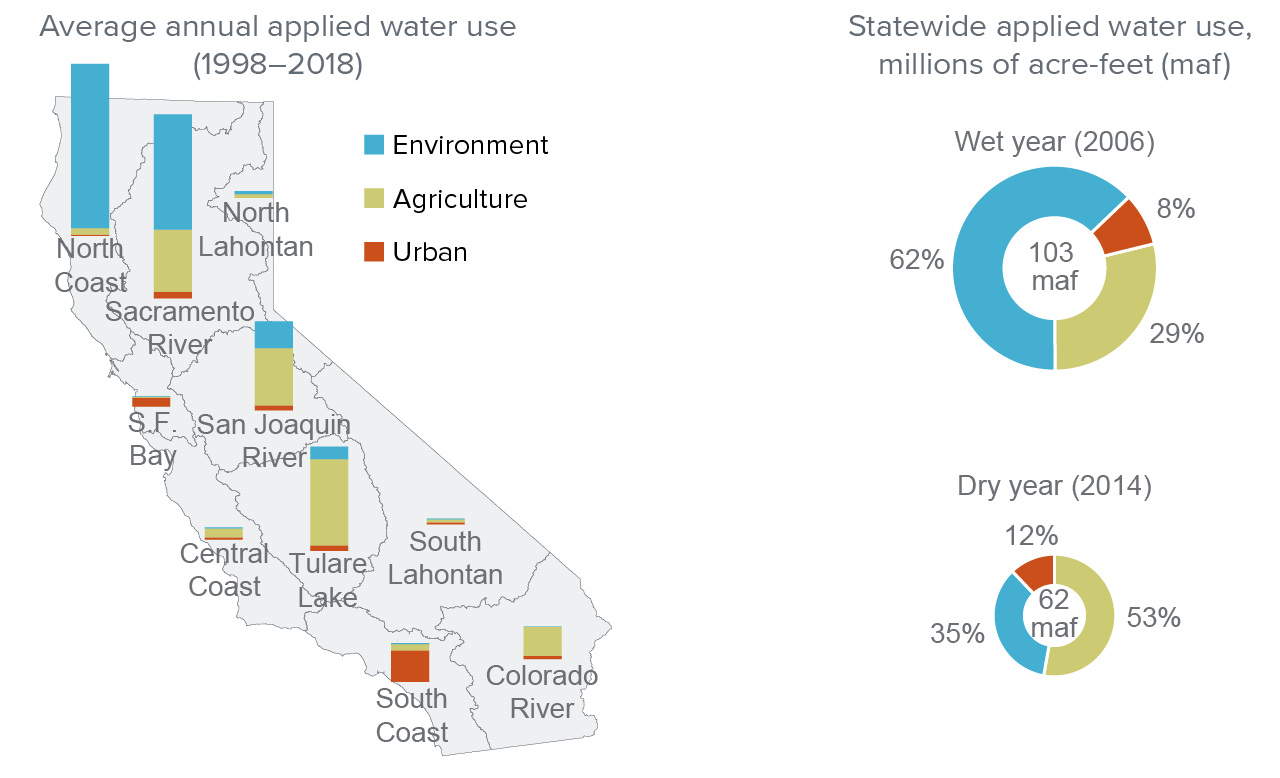
SOURCE: Department of Water Resources.
NOTE: Data for 2017 were not available.
Total urban water use has plateaued, even as the population has grown.
- Water use by urban, suburban, and rural communities—also known as urban water use—is highest in the San Francisco Bay Area and the South Coast; both regions rely primarily on water imported from elsewhere.
- Per-capita water use has been steadily falling, even before the 2012–16 drought made conservation a major priority. In severely affected areas, the 2020–22 drought resulted in large additional declines.
- Total urban use has plateaued, even though California’s population grew by 5.5 million from 2000–20.
- Initial water savings came mainly from more efficient indoor plumbing and fixtures; more recent efforts have also focused on reducing outdoor use, which accounts for nearly half of all urban use.
The amount of water used by communities and farms peaked in the mid-1990s
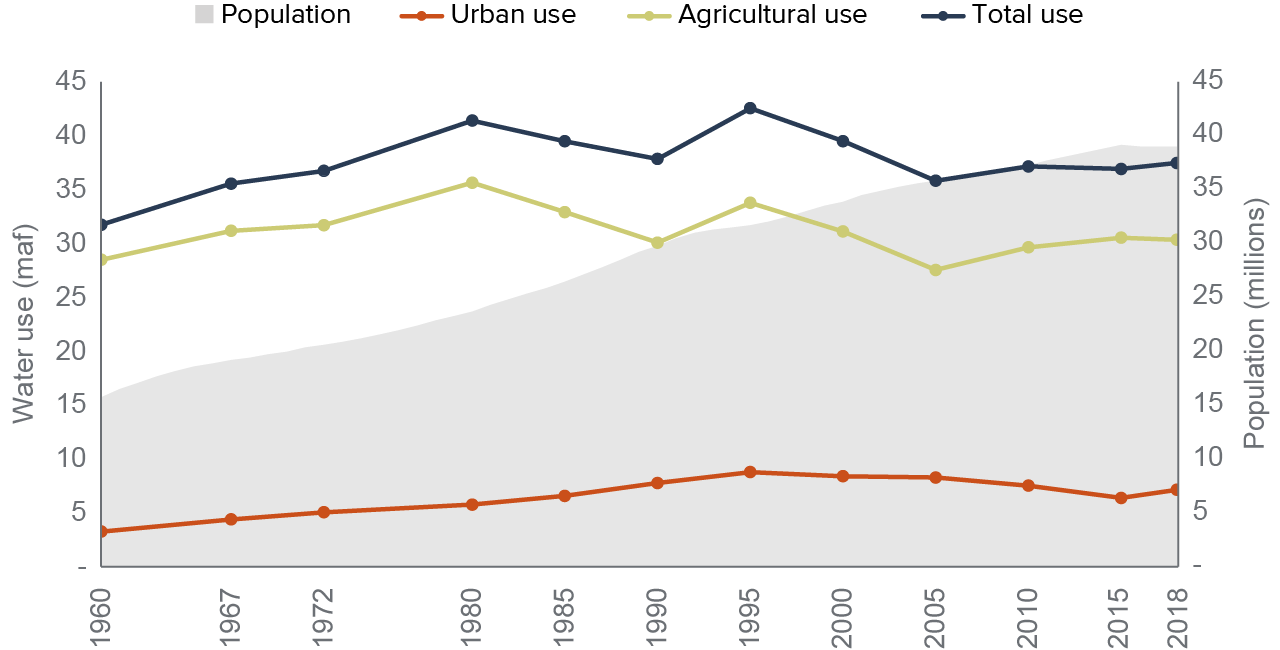
SOURCES: Water use: California Water Plan Updates (Department of Water Resources, various years). Population: Department of Finance.
NOTES: The figure shows “applied” water delivered to homes and businesses. “Net” water use—i.e., the volume consumed by people or plants, embodied in manufactured goods, evaporated, or discharged to saline waters—is lower. Totals exclude water used by power plants and groundwater recharge projects and water lost during conveyance. Estimates are for water years (October to September). Pre-2000 estimates are adjusted to levels for a year of normal rainfall. Except for 2015 (a critically dry year), estimates from 2000 onward are for actual use in years with near-normal precipitation.
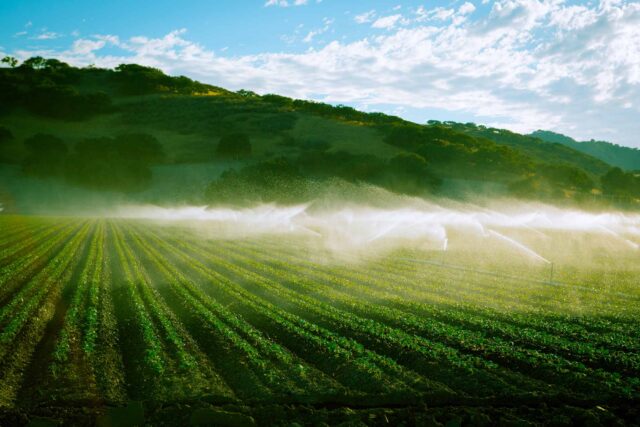
Agricultural water use has changed little, while the value of production has grown.
- California has 8.5 million acres of irrigated cropland. Perennial fruit and nut crops’ share (led by almonds) has increased, up from roughly a quarter of irrigated acreage in 2000 to nearly half in 2018. In the San Joaquin Valley, perennials cover over 60% of irrigated acreage.
- Although irrigated acreage and farm water use have not grown, the value of agricultural output has been rising, reflecting the shift toward perennials. Adjusted for inflation, farm GDP was 23% higher in 2018 than in 1980, while farm water use was 15% lower.
- Farms use both surface water—sometimes imported across long distances—and groundwater. Groundwater use increases in dry years, when surface supplies are lower.
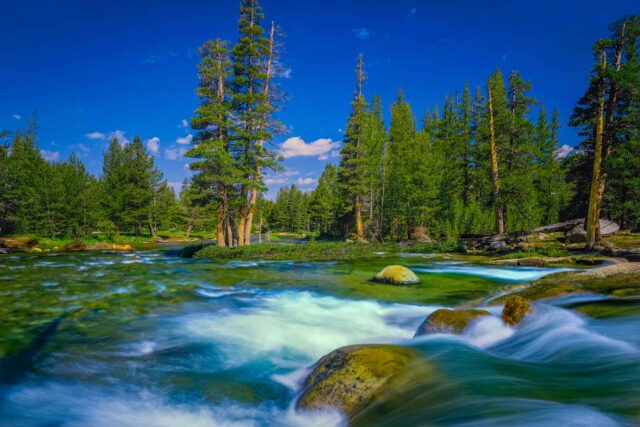
Environmental water supports people and ecosystems in a variety of settings.
- Environmental water supports natural infrastructure that is important to people and freshwater biodiversity. Water use by the environment falls under four categories: wild and scenic rivers, instream ecosystem use, water quality maintenance for communities and farms, and wetlands within wildlife preserves.
- The environment’s share of water use varies dramatically by region. The majority (63%) occurs in wild and scenic rivers, primarily in the north of the state.
- In wet years, environmental water makes up a larger share of available water (61%) than in dry years (41%); in critically dry years it can plummet. The damage to freshwater ecosystems and species can take years to repair.
Drought and SGMA will impact future water use.
- Cities avoided major supply disruptions in the 2012–16 and 2020–22 droughts, reflecting long-term investments in supplies and demand management. Small communities that depend on wells are much more vulnerable during droughts, when groundwater levels fall.
- Groundwater is a key drought reserve for agriculture, but long-term overpumping threatens this resource. The 2014 Sustainable Groundwater Management Act requires pumpers to reach sustainability by the early 2040s.
- SGMA will cause farm water use to fall, especially in critically overdrafted basins. Efforts to augment supply (e.g., through groundwater recharge) and flexible water trading rules can lessen the economic impacts.
- Droughts hit the environment hard. Allocating a portion of supplies to the environment—rather than managing for restrictive minimum flow requirements—could help improve freshwater ecosystems’ health.
Topics
Safe Drinking Water Water Supply Water, Land & Air